 Business Analysis Techniques: A Comprehensive Guide")
Essential (BI) Business Analysis Techniques: A Comprehensive Guide
In today’s fast-paced business environment, efficient business analysis techniques are crucial to achieving success and expansion for organizations. Business analysts use a variety of techniques to grasp business requirements, create solutions, and facilitate change. This comprehensive manual will discuss the key business analysis methods, detailing their functionalities and benefits, including how business intelligence tools and data visualization can enhance these processes.
Introduction to (BI) Business Analytics Techniques
Business analysis is a field of study that assists businesses in recognizing their requirements and finding answers to different issues. Developing software systems is often a part of the solution, along with process improvement, organizational adjustments, strategic planning, and policy creation.
The Role of Business Analysts
Business analysts help organizations identify areas for improvement, streamline processes, and implement technology solutions. They are essential in various industries, including finance, healthcare, retail, and technology. With the right techniques, business analysts can drive efficiencies, reduce costs, and enhance overall business performance. Tools like business intelligence (BI) systems are integral to this process, aiding in making data-driven decisions.
Importance of Business Analysis Techniques
Utilizing the right business analysis techniques can assist in achieving the benefits mentioned below.
- Identifying business needs: Techniques help in understanding what the business requires.
- Defining clear requirements: Proper techniques ensure that the requirements are well-documented and communicated.
- Ensuring stakeholder engagement: Techniques facilitate effective communication with stakeholders.
- Enhancing project success: By applying the right techniques, projects are more likely to be successful in delivering expected outcomes.
Top Business Analysis Techniques
SWOT Analysis for Business Growth
SWOT Analysis is a technique of strategic planning that helps identify the strengths, weaknesses, opportunities, and threats associated with business competition or project planning.
- Strengths: Internal factors that are advantageous to achieving the objective.
- Weaknesses: Internal factors that could hinder the objective.
- Opportunities: External factors that the organization could exploit to its advantage.
- Threats: External factors that could cause trouble for the business or project.
Application of SWOT Analysis
A SWOT Analysis can be carried out by assembling a group of important stakeholders and leading a collaborative idea-generation session. Utilize a grid to outline strengths, weaknesses, opportunities, and threats, and subsequently create tactics to leverage strengths and opportunities while addressing weaknesses and threats.
Real-World Example:
A retail company utilized SWOT Analysis to identify their strong brand presence (strength), limited online presence (weakness), the growing trend of e-commerce (opportunity), and increased competition (threat). This analysis led to a successful strategy to expand their online operations.

PESTLE ANALYSIS FOR STRATEGIC PLANNING
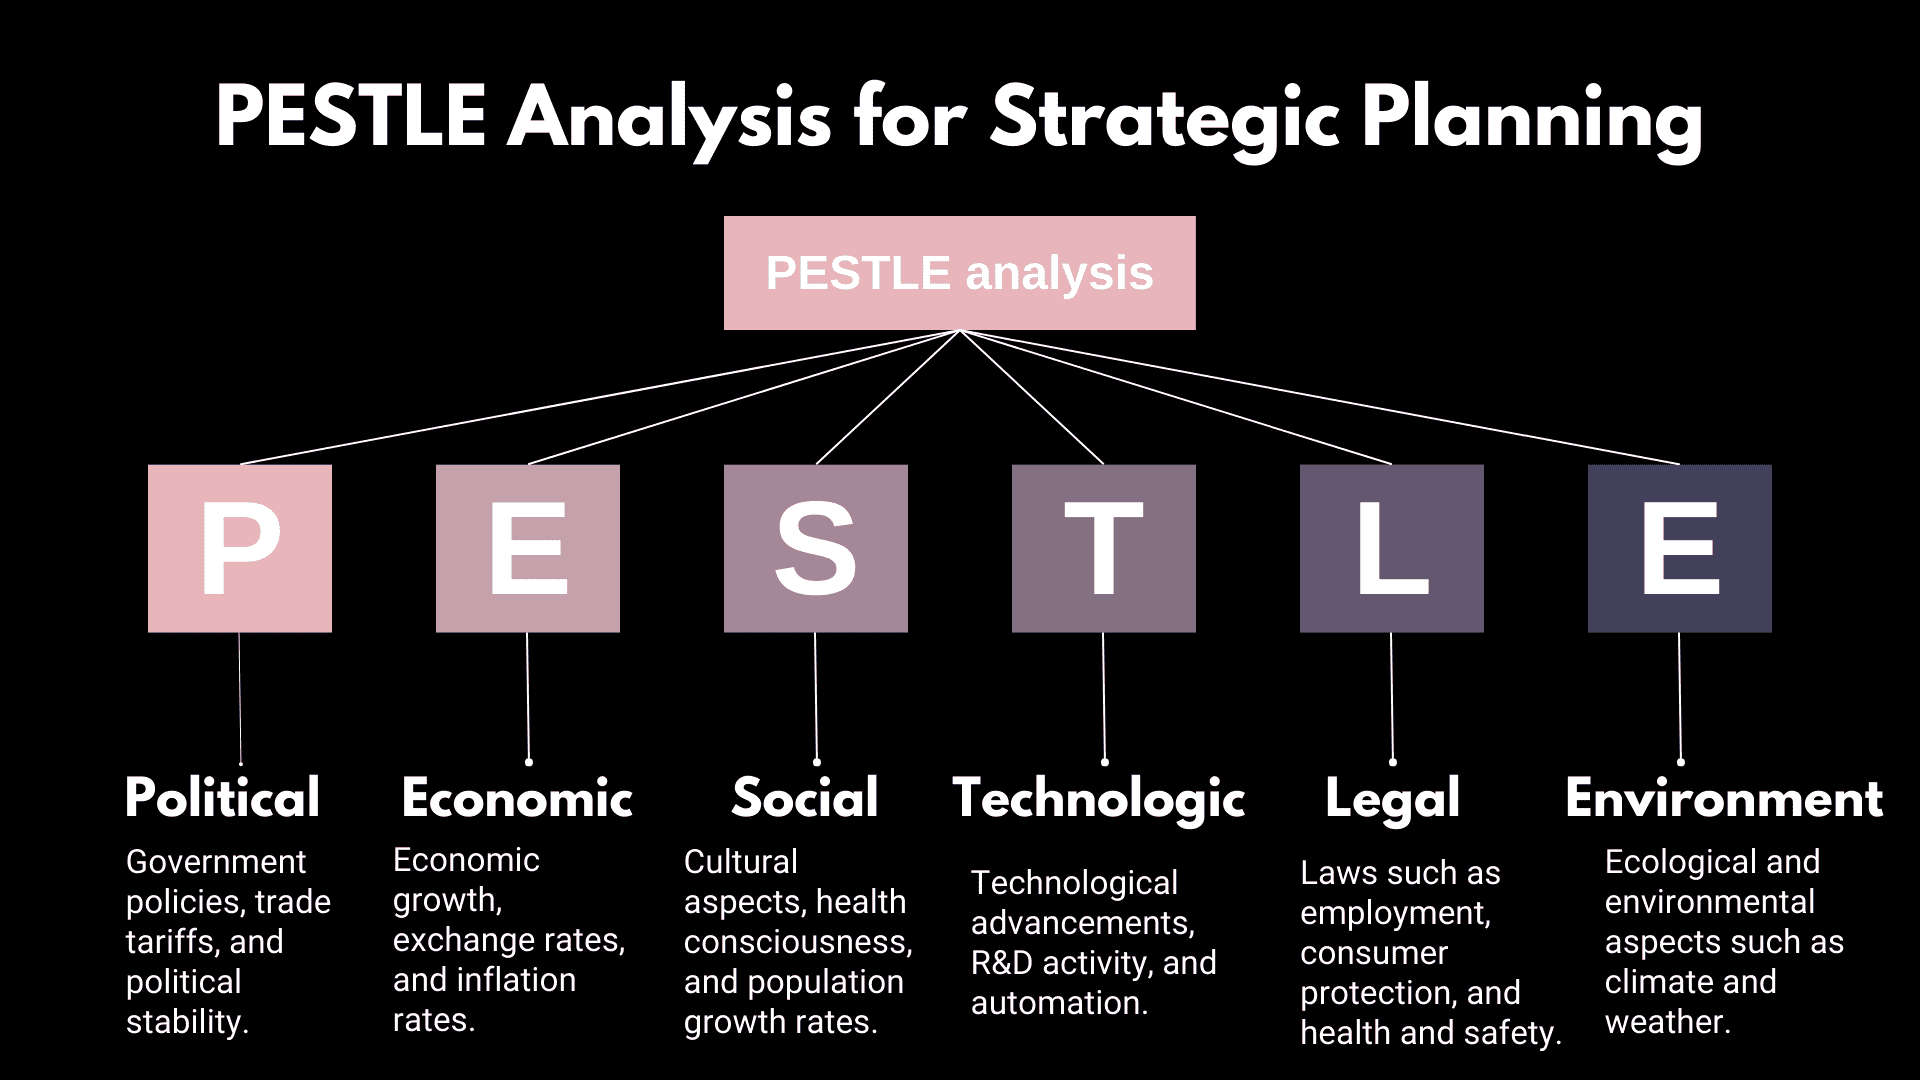
PESTLE Analysis is a technique utilized for examining the external factors affecting a company, including Political, Economic, Social, Technological, Legal, and Environmental aspects.
- Political: Government policies, trade tariffs, and political stability.
- Economic: Economic growth, exchange rates, and inflation rates.
- Social: Cultural aspects, health consciousness, and population growth rates.
- Technological: Technological advancements, R&D activity, and automation.
- Legal: Laws such as employment, consumer protection, and health and safety.
- Environmental: Ecological and environmental aspects such as climate and weather.
Application of PESTLE Analysis
To conduct a PESTLE Analysis, investigate and gather the elements in every category that influence your Business. Examine the gathered data to comprehend the external surroundings and how it might influence your strategic decisions.
Case Study:
A manufacturing company used PESTLE Analysis to evaluate the impact of environmental regulations on their production processes. This analysis led to the adoption of greener technologies and practices, aligning with regulatory requirements and consumer expectations.
Download Manufacturing Case Studies
BUSINESS PROCESS MODELING (BPM) FOR PROCESS IMPROVEMENT
Business Process Modeling includes producing visual representations of business processes to analyze and improve them. Common techniques include:
- Flowcharts: Simple diagrams that show steps in a process.
- BPMN (Business Process Model and Notation): Standardized method to illustrate business processes.
- Data Flow Diagrams (DFD): Visual representations of data flow within a system.
Application of Business Process Modeling
Identify the process that has to be modeled, and collect the relevant data. To ensure accuracy and clarity, create a visual representation using flowcharts, BPMN, or DFD. Analyze the model to find opportunities for improvement and inefficiencies.
Example:
A financial services firm used BPM to streamline their loan approval process. By mapping out the entire process, they identified redundancies and delays, resulting in a 30% reduction in processing time.
USE CASE MODELING FOR SYSTEM INTERACTIONS
Use Case Modeling defines how a system interacts with a user or another system to achieve a specific goal. This technique includes:
- Actors: Users or other systems that interact with the system.
- Use Cases: The particular interactions between actors and the system to achieve a goal.
- Scenarios: Detailed descriptions of how actors interact with the system in different situations.
Application of Use Case Modeling
Identify the actors and define their roles. Create use cases that describe their interactions with the system. Develop scenarios to provide detailed insights into various use cases. Use visual diagrams to represent these interactions for better understanding.
Example:
A software development team used Use Case Modeling to design a new Customer Relationship Management (CRM) system. By identifying all potential user interactions, they ensured that the system’s design was user-friendly and met all necessary requirements.
REQUIREMENTS ELICITATION TECHNIQUES FOR EFFECTIVE REQUIREMENT GATHERING
Requirements Elicitation is the technique of collecting requirements from stakeholders. Common techniques include:
- Interviews: Direct discussions with stakeholders.
- Workshops: Group sessions to gather requirements collaboratively.
- Surveys/Questionnaires: Written sets of questions to gather stakeholder input.
- Observation: Watching how users interact with the system or process.
- Document Analysis: Reviewing existing documentation to understand current processes and requirements.
Application of Requirements Elicitation
Select the most suitable method of getting information depending on the specific project’s circumstances. Interview key stakeholders, host workshops, distribute surveys, observe end-users, and analyze documents to collect thorough requirements.
Best Practices:
Ensure clear communication with stakeholders and verify requirements through multiple sources to prevent misunderstandings. Regularly review and update requirements as the project progresses.
MOSCOW PRIORITIZATION FOR REQUIREMENT MANAGEMENT
MoSCoW stands for Must have, Should have, Could have, and Won’t have. This technique helps in prioritizing requirements based on their importance.
- Must have: Critical requirements that are non-negotiable.
- Should have: Important but not critical requirements.
- Could have: Desirable but not necessary features.
- Won’t have: Features that are agreed upon as least priority or not to be included.
Application of MoSCoW Prioritization
Work with stakeholders to classify every requirement as Must have, Should have, Could have, or Won’t have. Utilize this prioritization method to concentrate on crucial requirements and efficiently control the project scope.
Integration with Agile:
MoSCoW Prioritization is often used in Agile projects to determine the minimum viable product (MVP) and ensure that the most critical features are developed first. It helps teams prioritize work and make informed decisions about trade-offs.
GAP ANALYSIS FOR IDENTIFYING IMPROVEMENT AREAS
Gap Analysis involves comparing the current condition of a process or system with its intended future state to identify shortcomings and areas in need of enhancement.
- Current State: The present condition of the process/system.
- Future State: The desired condition of the process/system.
- Gap: The differences between the current and future states.
Application of Gap Analysis Technique
Document the current state of the process or system. Identify the desired future state and note the differences between the current state and the desired future state. Create strategies to close these discrepancies and reach the intended future condition.
Data Visualization Tools:
Include a gap analysis chart or diagram to visualize the differences and plan improvement actions. This visual representation can help communicate findings and recommendations to stakeholders for data-driven decisions.
ROOT CAUSE ANALYSIS FOR PROBLEM-SOLVING
The Root Cause Analysis (RCA) technique is a problem-solving approach that identifies the root cause of faults or problems.
- 5 Whys: Asking “why” five times to drill down to the root cause of a problem.
- Fishbone Diagram: Also known as the Ishikawa diagram, it helps to display potential causes of a specific problem visually.
Application of Root Cause Analysis
Asking “why” several times until you discover the root cause of a problem is a good way to apply the 5 Whys technique. Another way to identify potential reasons and the primary cause to arrive at a solution is to create a Fishbone Diagram.
Practical Application:
A manufacturing company facing quality issues used RCA to discover that inadequate training was the root cause. By implementing a comprehensive training program, they significantly improved product quality.
DESCRIPTIVE ANALYTICS FOR UNDERSTANDING HISTORICAL DATA
Descriptive Analytics involves analyzing historical data to gain insights into past events within the organization.
- Data Collection: Gather historical data from various sources.
- Data Analysis: Use statistical tools to analyze the data.
- Reporting: Generate reports to present the findings.
Application of Descriptive Analytics
Collect historical data relevant to the business problem. Use tools like Excel, Tableau, or Power BI to analyze the data and create visual representations and reports. Use these insights to understand past patterns and trends.
DIAGNOSTIC ANALYTICS FOR ANALYZING PAST PERFORMANCE
Diagnostic Analytics looks deeper at the data to figure out why something happened in the past.
- Data Analysis: Use advanced analytics techniques to dive deeper into the data.
- Correlation and Causation: Identify relationships between different data points.
- Root Cause Analysis: Determine the root causes of observed trends or issues.
Application of Diagnostic Analytics
Utilize tools like SQL, Python, or R for conducting thorough data analysis. Search for connections and relationships in the data to comprehend the reasons behind specific trends or patterns. Share the conclusions with stakeholders along with evidence to back them up.
PREDICTIVE ANALYTICS FOR FORECASTING FUTURE TRENDS
Predictive Analytics utilizes past data to predict upcoming events or patterns.
- Data Modeling: Build statistical models to predict future outcomes.man
- Machine Learning: Implement machine learning algorithms to enhance prediction accuracy.
- Scenario Analysis: Test different scenarios to predict possible outcomes.
Application of Predictive Analytics
Gather and prepare historical data for analysis. Use tools like SAS, R, or Python to develop predictive models. Implement machine learning algorithms to improve forecasts and explore different situations for strategic planning purposes.
PRESCRIPTIVE ANALYTICS FOR RECOMMENDING ACTIONS
Prescriptive Analytics offers guidance on managing future scenarios derived from predictive analytics.
- Optimization Models: Create models to optimize business decisions.
- Decision Algorithms: Develop algorithms that suggest actions based on predictive data.
- Simulation: Run simulations to test the impact of different decisions.
Application of Prescriptive Analytics
Utilize predictive models in conjunction with optimization techniques to produce practical recommendations. Utilize decision algorithms and simulation tools to evaluate the consequences of various strategies and select the optimal action.
User Story Mapping for Agile Development
User Story Mapping is a visual exercise used to create a holistic view of how user stories fit together to define a user’s journey.
User Stories: Short, simple descriptions of a feature from the perspective of the end-user.
Map: A visual representation of user stories organized into a coherent sequence that depicts the user journey.
Application of User Story Mapping:
Gather stakeholders and create user stories that describe specific features from the user’s perspective. Arrange these stories on a map to represent the overall user journey and identify any gaps or dependencies.
Agile Integration:
User Story Mapping is particularly useful in Agile development, helping teams understand the user’s experience and prioritize features based on value. It ensures that development efforts align with user needs and business goals.
Data Modeling for Information Systems
Data Modeling involves defining and analyzing the data requirements needed to support business processes. Common techniques include:
- Entity-Relationship Diagrams (ERD): Visual representations of the data and relationships within a system.
- Data Flow Diagrams (DFD): Diagrams that show how data moves within a system.
- Data Dictionaries: Comprehensive descriptions of data elements, including their attributes, definitions, and relationships.
Application of Data Modeling:
Identify the key data elements and relationships necessary for the system. Use ERDs and DFDs to create visual representations and ensure that data requirements align with business objectives.
Example:
A retail company used data modeling to design a new inventory management system. By creating detailed ERDs and DFDs, they ensured accurate tracking of inventory levels and streamlined the supply chain.
Conclusion of Business Analysis Techniques
Acquiring proficiency in these business analysis techniques can greatly improve a business analyst’s capacity to provide value to a company. By using the correct methods at the best moment, BAs can efficiently recognize needs, specify solutions, and lead to successful project results.
To maintain success, staying informed about industry trends and consistently improving your skills through training and practical experience is essential. Keep in mind that using the correct technique at the appropriate moment can have a significant impact.
Want to know more about business analysis techniques? Reach us at +1 727 756 1632 or peter@vuelitics.com.


Post Comments